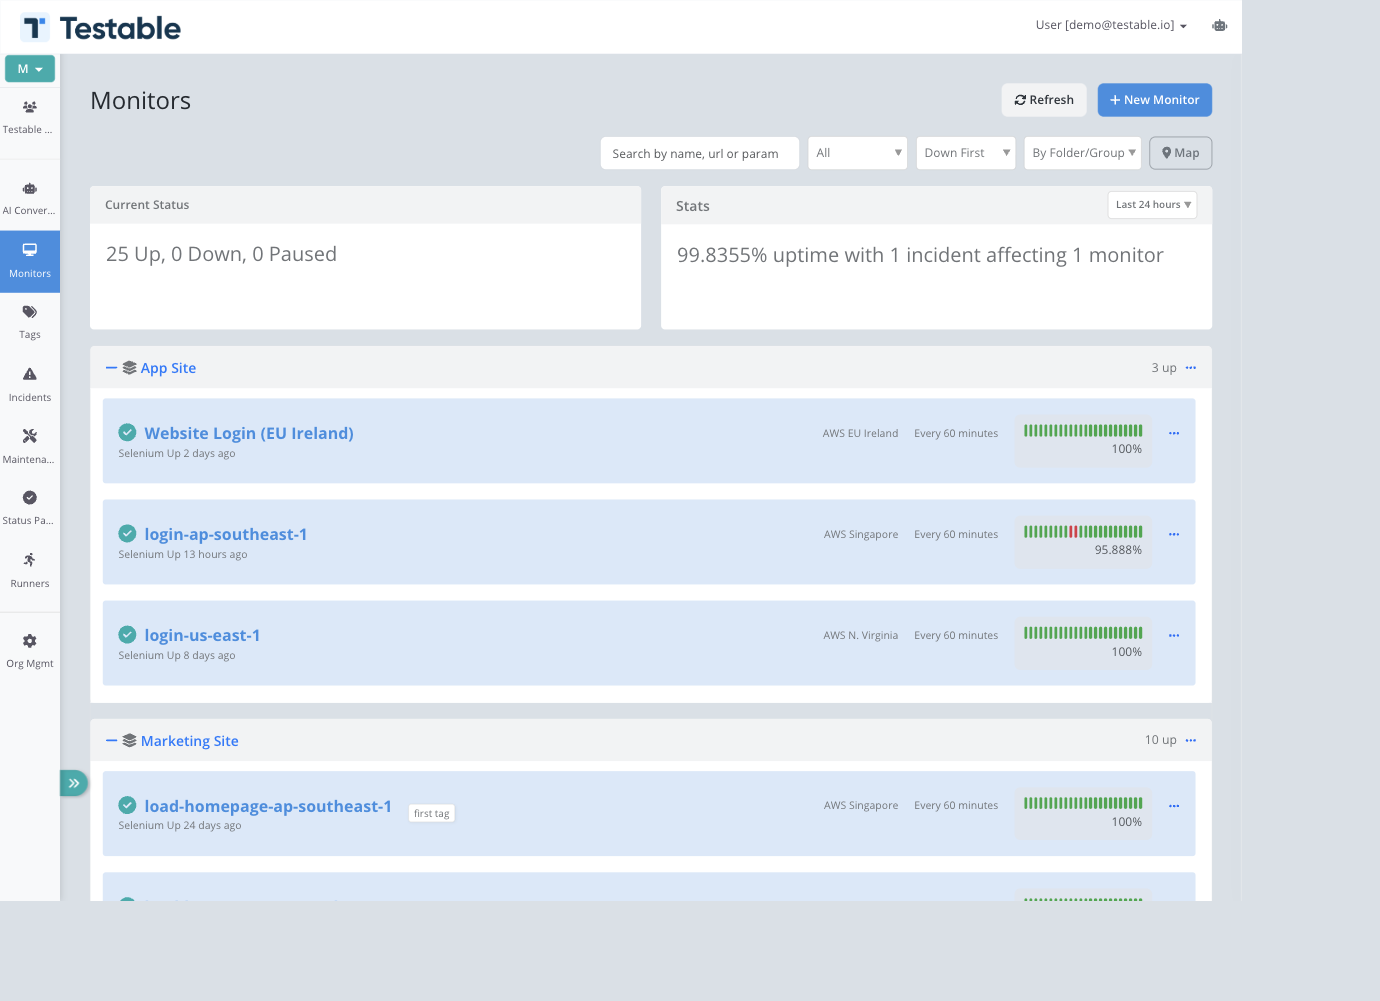
Monitor Overview
Monitors continuously check the health, availability, and behavior of your services. A monitor belongs to a folder and group, can be tagged, can use one or more runner regions, and records checks, incidents, metrics, activity, and comments over time.
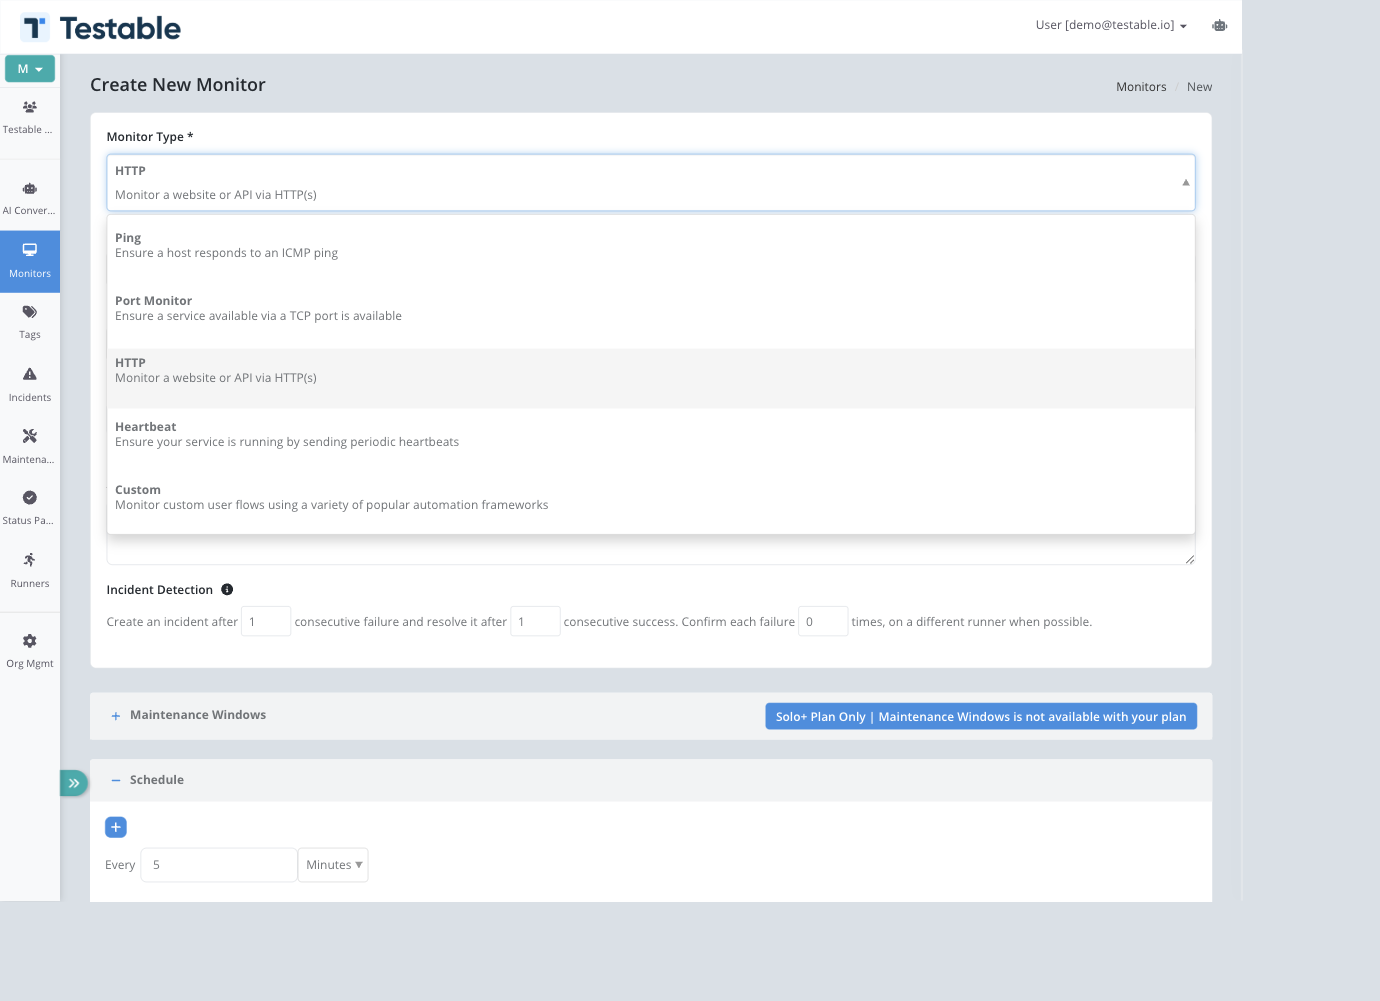
Monitor Types
| Type | Best for | Primary configuration |
|---|---|---|
| HTTP | Websites, APIs, health endpoints, webhook targets | Method, URL, accepted statuses, request body, headers, basic auth, response body validation, SSL and domain checks |
| Ping | Host reachability and basic network availability | Host or IP, request timeout, schedule, runner regions |
| Port Monitor | TCP service availability such as databases, SSH, queues, and custom services | Host, TCP port, request timeout, schedule, runner regions |
| Heartbeat | Services, jobs, workers, and clusters that report in from inside your environment | Heartbeat frequency, acceptable delay, min/max active sources, optional JSON metric capture |
| Custom | Browser journeys, API collections, load-test scripts, and custom business checks | Scenario type, reusable scenario, scenario parameters, schedule, runner regions |
Custom Monitor Scenario Types
Custom monitors can run several kinds of reusable scenarios. The main supported scenario types are:
- Playwright - Playwright Library scripts or Playwright Test suites.
- Puppeteer - Puppeteer scripts and generated Load in Chrome checks.
- Selenium - Selenium/WebDriver workflows including Webdriver.io, Protractor, JavaScript, Java, and Serenity styles.
- Postman - Postman collections.
- Node.js Script - JavaScript executed in a sandboxed Node.js environment.
- Locust - Python Locust files or Locust4j.
- JMeter - JMeter test plans.
- Gatling - Gatling simulations.
- HAR Replay - Uploaded HTTP Archive files replayed as scenarios.
- Java - Java code such as JUnit or TestNG checks.
- PhantomJS or SlimerJS - Legacy browser scripts.
- Monitor - Reusable protocol-level monitor scenarios for HTTP, ping, port, and related endpoint checks.
- AI - Natural-language scenario generation when enabled for the organization.
Shared Settings
Folder, Group, Name, and Description
Every monitor has a folder and group. Use folders for broad structure and groups for related monitors within a folder. Monitor descriptions support Markdown and appear on monitor details and, when enabled, status pages.
Incident Detection
Non-heartbeat monitors can require multiple consecutive failures before opening an incident and multiple consecutive successes before resolving it. You can also add confirmation checks so each scheduled failure is immediately retried on another runner when possible.
Schedules
Non-heartbeat monitors run on one or more schedules. Plans that include one-minute intervals can add multiple schedule rows; otherwise the minimum interval is five minutes.
Regions and Runners
HTTP, ping, port, and custom monitors run from Testable-hosted or self-hosted runner regions. Multiple regions help detect regional failures and compare performance by geography. Heartbeat monitors do not use runner regions because the monitored system pushes pings to Testable.
Maintenance Windows
Monitors can be associated with maintenance windows directly, or inherit windows through folder, group, or tag associations. Inherited windows are shown on the monitor form but cannot be removed from the monitor itself.
Notifications
Monitors can use organization defaults or custom notification targets. Notifications can be sent for incidents, successful checks, new comments, SSL expiry, and domain expiry depending on monitor type and plan features.
Success Criteria and Metrics
Success criteria define which metric thresholds must pass. Defaults can be configured at the organization level and overridden per monitor. Metrics can also be customized so monitor detail pages and status pages emphasize the measurements your team cares about.
Monitor Lifecycle
- Create the monitor and choose the monitor type.
- Configure target details, organization, schedules or heartbeat timing, regions, notifications, and success criteria.
- Run checks automatically on schedule or receive heartbeat pings.
- Detect incidents when failure rules are met.
- Resolve incidents when recovery rules are met.
- Review checks, pings, metrics, incidents, activity, and comments.
- Pause, edit, copy, or delete monitors as services change.
Best Practices
- Name monitors after the service and behavior being checked.
- Use folders and groups for hierarchy, then tags for cross-cutting filters like environment, team, or criticality.
- Use confirmation checks for noisy endpoints instead of masking failures with very long intervals.
- Use multiple regions for public services and self-hosted runners for private services.
- Set maintenance windows before planned work so uptime and notifications reflect expected downtime.
- Keep status page associations broad when possible by using folders, groups, or tags instead of hand-picking every monitor.