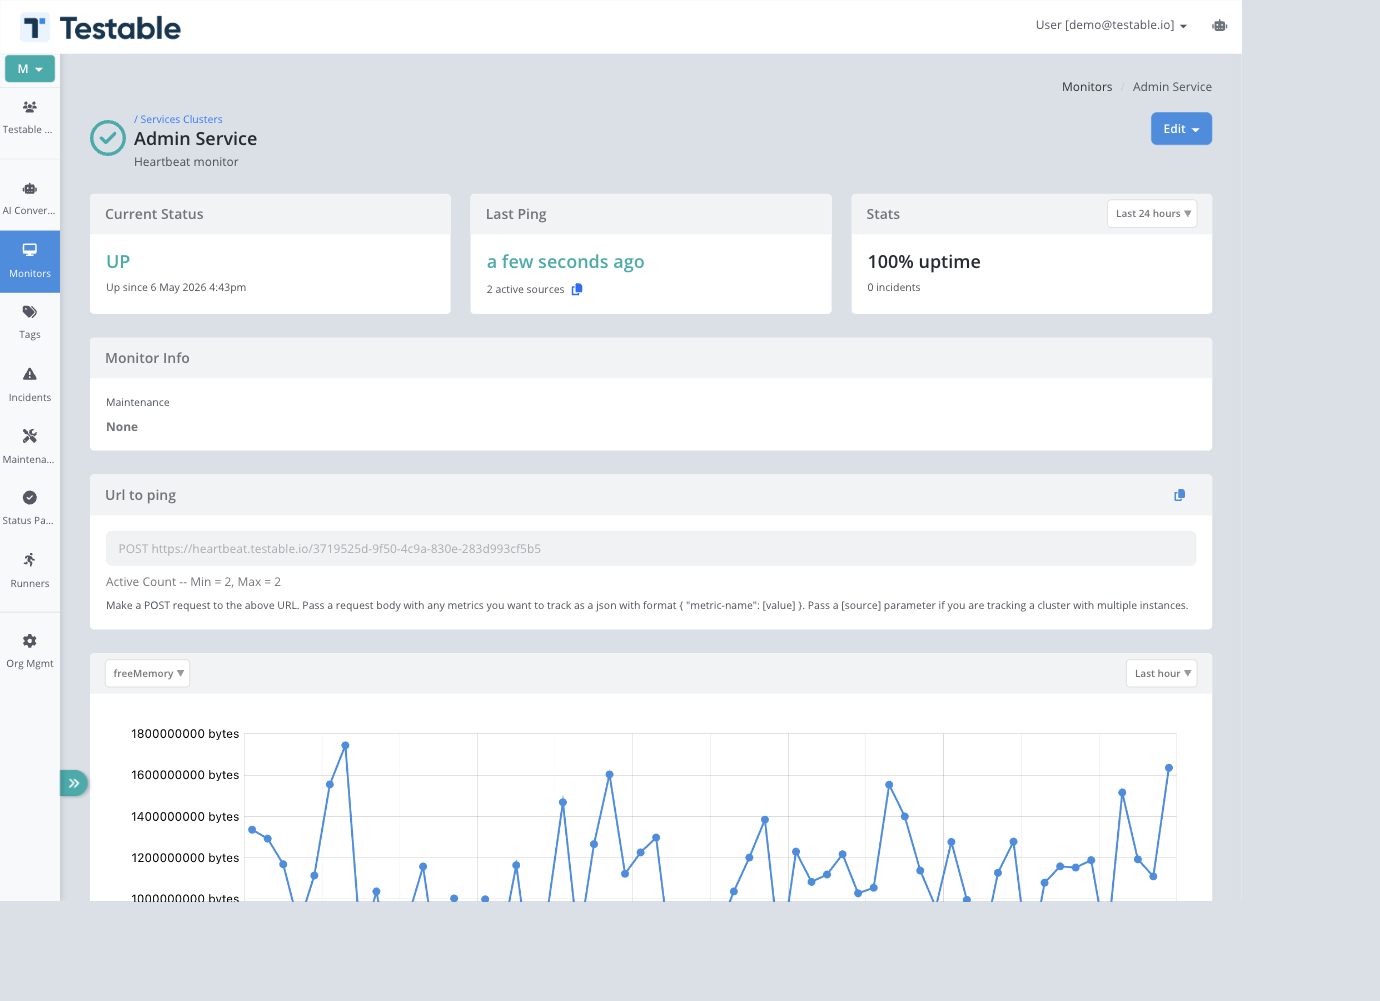
Heartbeat Monitor
Heartbeat monitors invert the normal monitoring flow. Instead of Testable runners calling your service, your service sends an HTTP POST ping to a unique Testable URL. If pings stop arriving on time, or the number of active sources falls outside the configured range, Testable opens an incident.
Configuration
- Heartbeat Frequency - How often each source is expected to ping, in minutes.
- Acceptable Delay - Extra grace time, in seconds, before a missing ping is treated as a failure.
- Minimum Active - The minimum number of sources that must be considered active.
- Maximum Active - The maximum number of sources expected. This helps catch runaway or duplicated workers.
- Pass metrics with body of heartbeats - When enabled, JSON values posted in heartbeat bodies are charted on the monitor and status page details.
Sending Pings
The monitor detail page shows the ping URL and copy action. Send an HTTP POST request to that URL from each job, service, or worker instance.
Single Source
curl -X POST https://heartbeat.testable.io/YOUR-HEARTBEAT-IDCluster Source Tracking
Pass a source query parameter to identify each instance in a cluster. Testable tracks the most recent ping per source and displays active source counts in the monitor list and detail page.
curl -X POST "https://heartbeat.testable.io/YOUR-HEARTBEAT-ID?source=worker-01"Metrics in the Request Body
When metric capture is enabled, send a JSON object in the request body. Values are converted into metrics and can be selected in charts.
curl -X POST "https://heartbeat.testable.io/YOUR-HEARTBEAT-ID?source=worker-01" \
  -H "Content-Type: application/json" \
  -d '{"freeMemory[bytes]": 702853712, "cpu": 33, "systemLoadAverage": 1.2}'
Viewing Heartbeat Data
Heartbeat monitor details show current status, last ping, active source count, uptime stats, the POST URL, active count rules, metric charts, incidents, activity, pings, and comments.
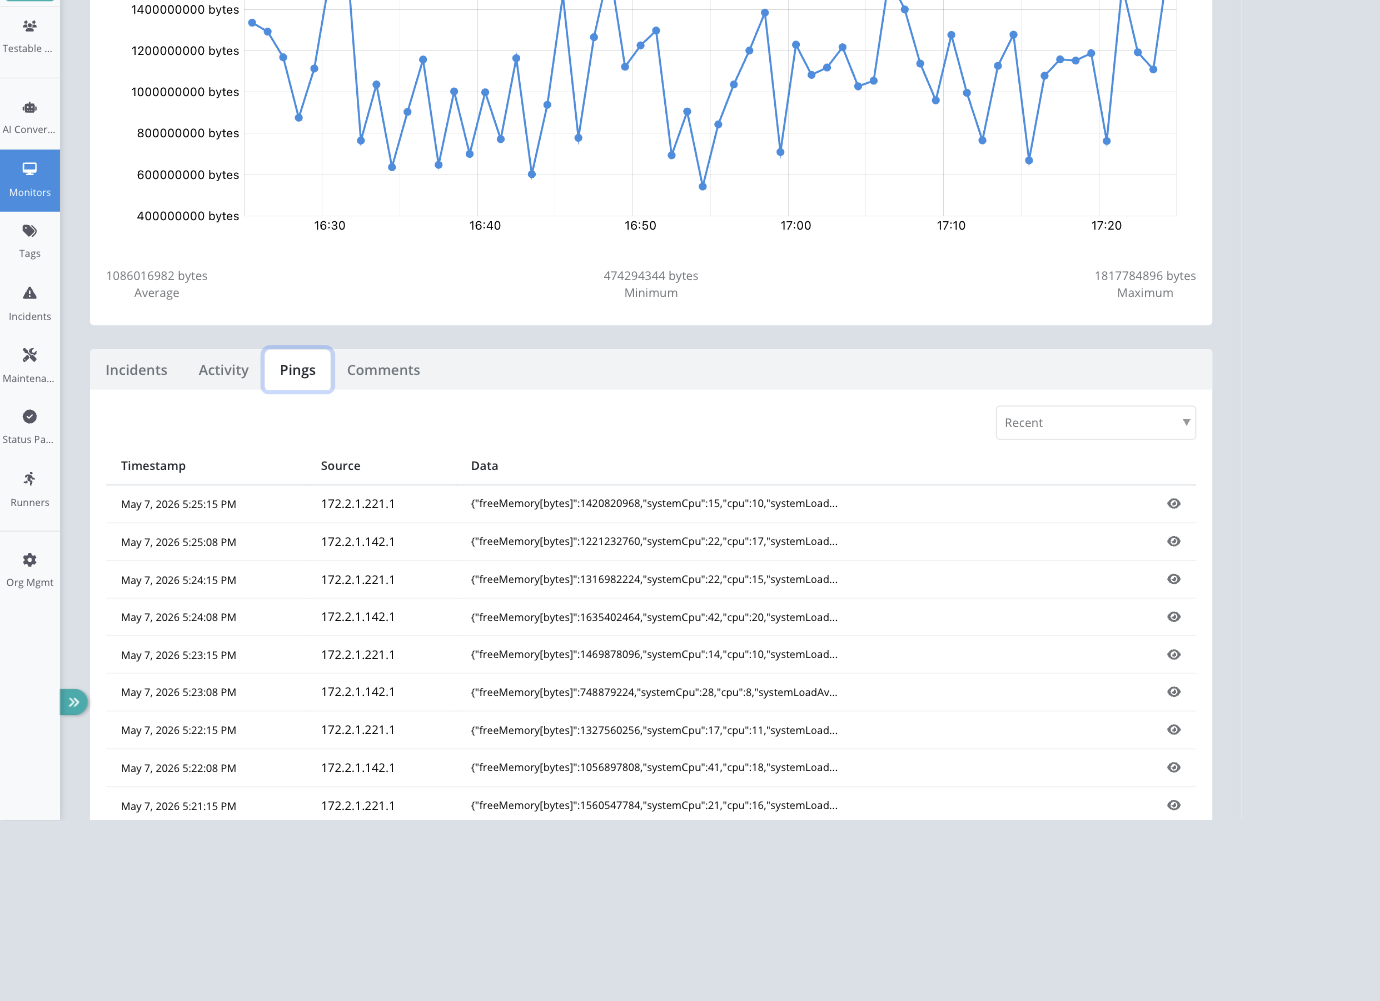
Pings Tab
The Pings tab lists recent heartbeat pings with timestamp, source, and truncated data. Large JSON bodies can be opened in a viewer for inspection.
Incidents
Heartbeat incident pages show timing plus heartbeat-specific details: pings at incident start, pings at resolution, and the monitor configuration that was in effect.
Use Cases
- Cron jobs - Ping at the end of a scheduled task so missed runs create incidents.
- Background services - Report from services that do not expose a public endpoint.
- Worker pools - Use min/max active sources to verify enough workers are alive.
- Internal systems - Monitor private services without opening inbound firewall rules.
- Lightweight telemetry - Attach JSON metric values to heartbeat bodies and chart them over time.
Best Practices
- Set the heartbeat frequency slightly longer than the expected loop or job cadence.
- Use acceptable delay for normal jitter instead of setting a very long frequency.
- Use stable source names for clusters, such as hostnames, instance IDs, or worker IDs.
- Keep metric payloads small and consistent so charts remain useful.
- Alert on both too few and too many active sources when duplicated workers would be harmful.